Résultats du Second Tour des Élections Législatives
18 juin 2017
| Doulaincourt | Saucourt | Total | % des exprimés | |
| INSCRITS | 477 | 110 | 587 | |
| VOTANTS | 268 | 67 | 335 | |
| BLANCS | 17 | 8 | 25 | |
| NULS | 3 | 1 | 4 | |
| EXPRIMES | 248 | 58 | 303 | |
| F. FABRE | 153 | 32 | 185 | 56,05% |
| F. CORNUT-GENTILLE | 95 | 26 | 121 | 36,66% |

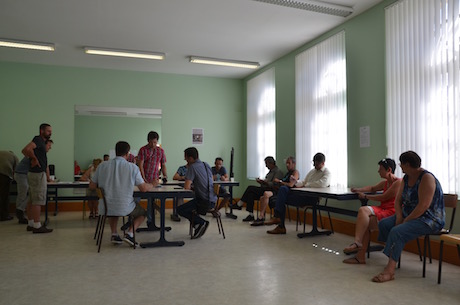
Résultats du Premier Tour des Élections Législatives
11 juin 2017
| Doulaincourt | Saucourt | Total | % des exprimés | |
| INSCRITS | 587 | |||
| VOTANTS | 260 | 64 | 324 | |
| BLANCS | 3 | 3 | 6 | |
| NULS | 0 | 0 | 0 | |
| EXPRIMES | 257 | 61 | 318 | |
| V. BERTHET | 33 | 12 | 45 | 14,1% |
| F. FABRE | 131 | 28 | 159 | 50,0% |
| A. DESFRETIER | 11 | 2 | 13 | 4,1% |
| D. MONNIER | 21 | 7 | 28 | 8,8% |
| F. CORNUT-GENTILLE | 57 | 11 | 68 | 21,4% |
| E. GONZALEZ | 0 | 0 | 0 | 0% |
| L. OLIVIER | 0 | 0 | 0 | 0% |
| V. ROFFIDAL | 4 | 0 | 4 | 1,2% |
| A. HALIN | 0 | 1 | 1 | 0,3% |
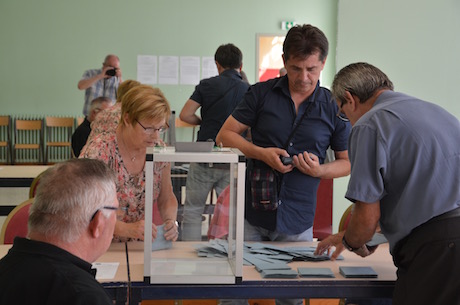
Résultats du Second Tour de l’ Election Présidentielle
7 mai 2017 à Doulaincourt et Saucourt
| INSCRITS | 476 | 111 |
| VOTANTS | 378 | 88 |
| BLANCS | 37 | 12 |
| NULS | 11 | 3 |
| EXPRIMES | 330 | 73 |
| Marine LE PEN | 197 | 43 |
| Emmanuel MACRON | 133 | 30 |
Résultats du Premier Tour de l’ Election Présidentielle
23 avril 2017 à Doulaincourt et Saucourt
| INSCRITS | 476 | 111 |
| VOTANTS | 381 | 96 |
| BLANCS | 13 | 6 |
| NULS | 1 | 1 |
| EXPRIMES | 367 | 89 |
| Nathalie ARTHAUD | 1 | 1 |
| François ASSELINEAU | 0 | 0 |
| Jacques CHEMINADE | 2 | 0 |
| Nicolas DUPONT-AIGNAN | 8 | 6 |
| Benoît HAMON | 11 | 2 |
| François FILLON | 72 | 19 |
| Jean LASSALLE | 5 | 0 |
| Marine LE PEN | 165 | 32 |
| Emmanuel MACRON | 47 | 11 |
| Jean-Luc MELENCHON | 45 | 15 |
| Philippe POUTOU | 11 | 3 |
